 By
By
Welcome to your Bountiful Almond Market Update.
Bountiful Almond Market updates are sent weekly on Wednesdays. If you're missing some you can subscribe here.
Bountiful Bloom updates were released on Fridays during bloom. 👉 The last five Bountiful Bloom updates: Feb 17th, Feb 24th, Mar 3rd, Mar 13th, and Mar 17th if you missed any.
This week we're covering:
- A look at new sales, and how they're converting into actual shipments
Let me know if you're having trouble accessing data on the Bountiful platform via the links below 👇 I'm here to help.
Keep reading for this week's latest or sign in to the Bountiful platform to access your Agriculture, Market, and Community data-driven insights.
🤓 A look at new sales, and how they're converting into shipments...
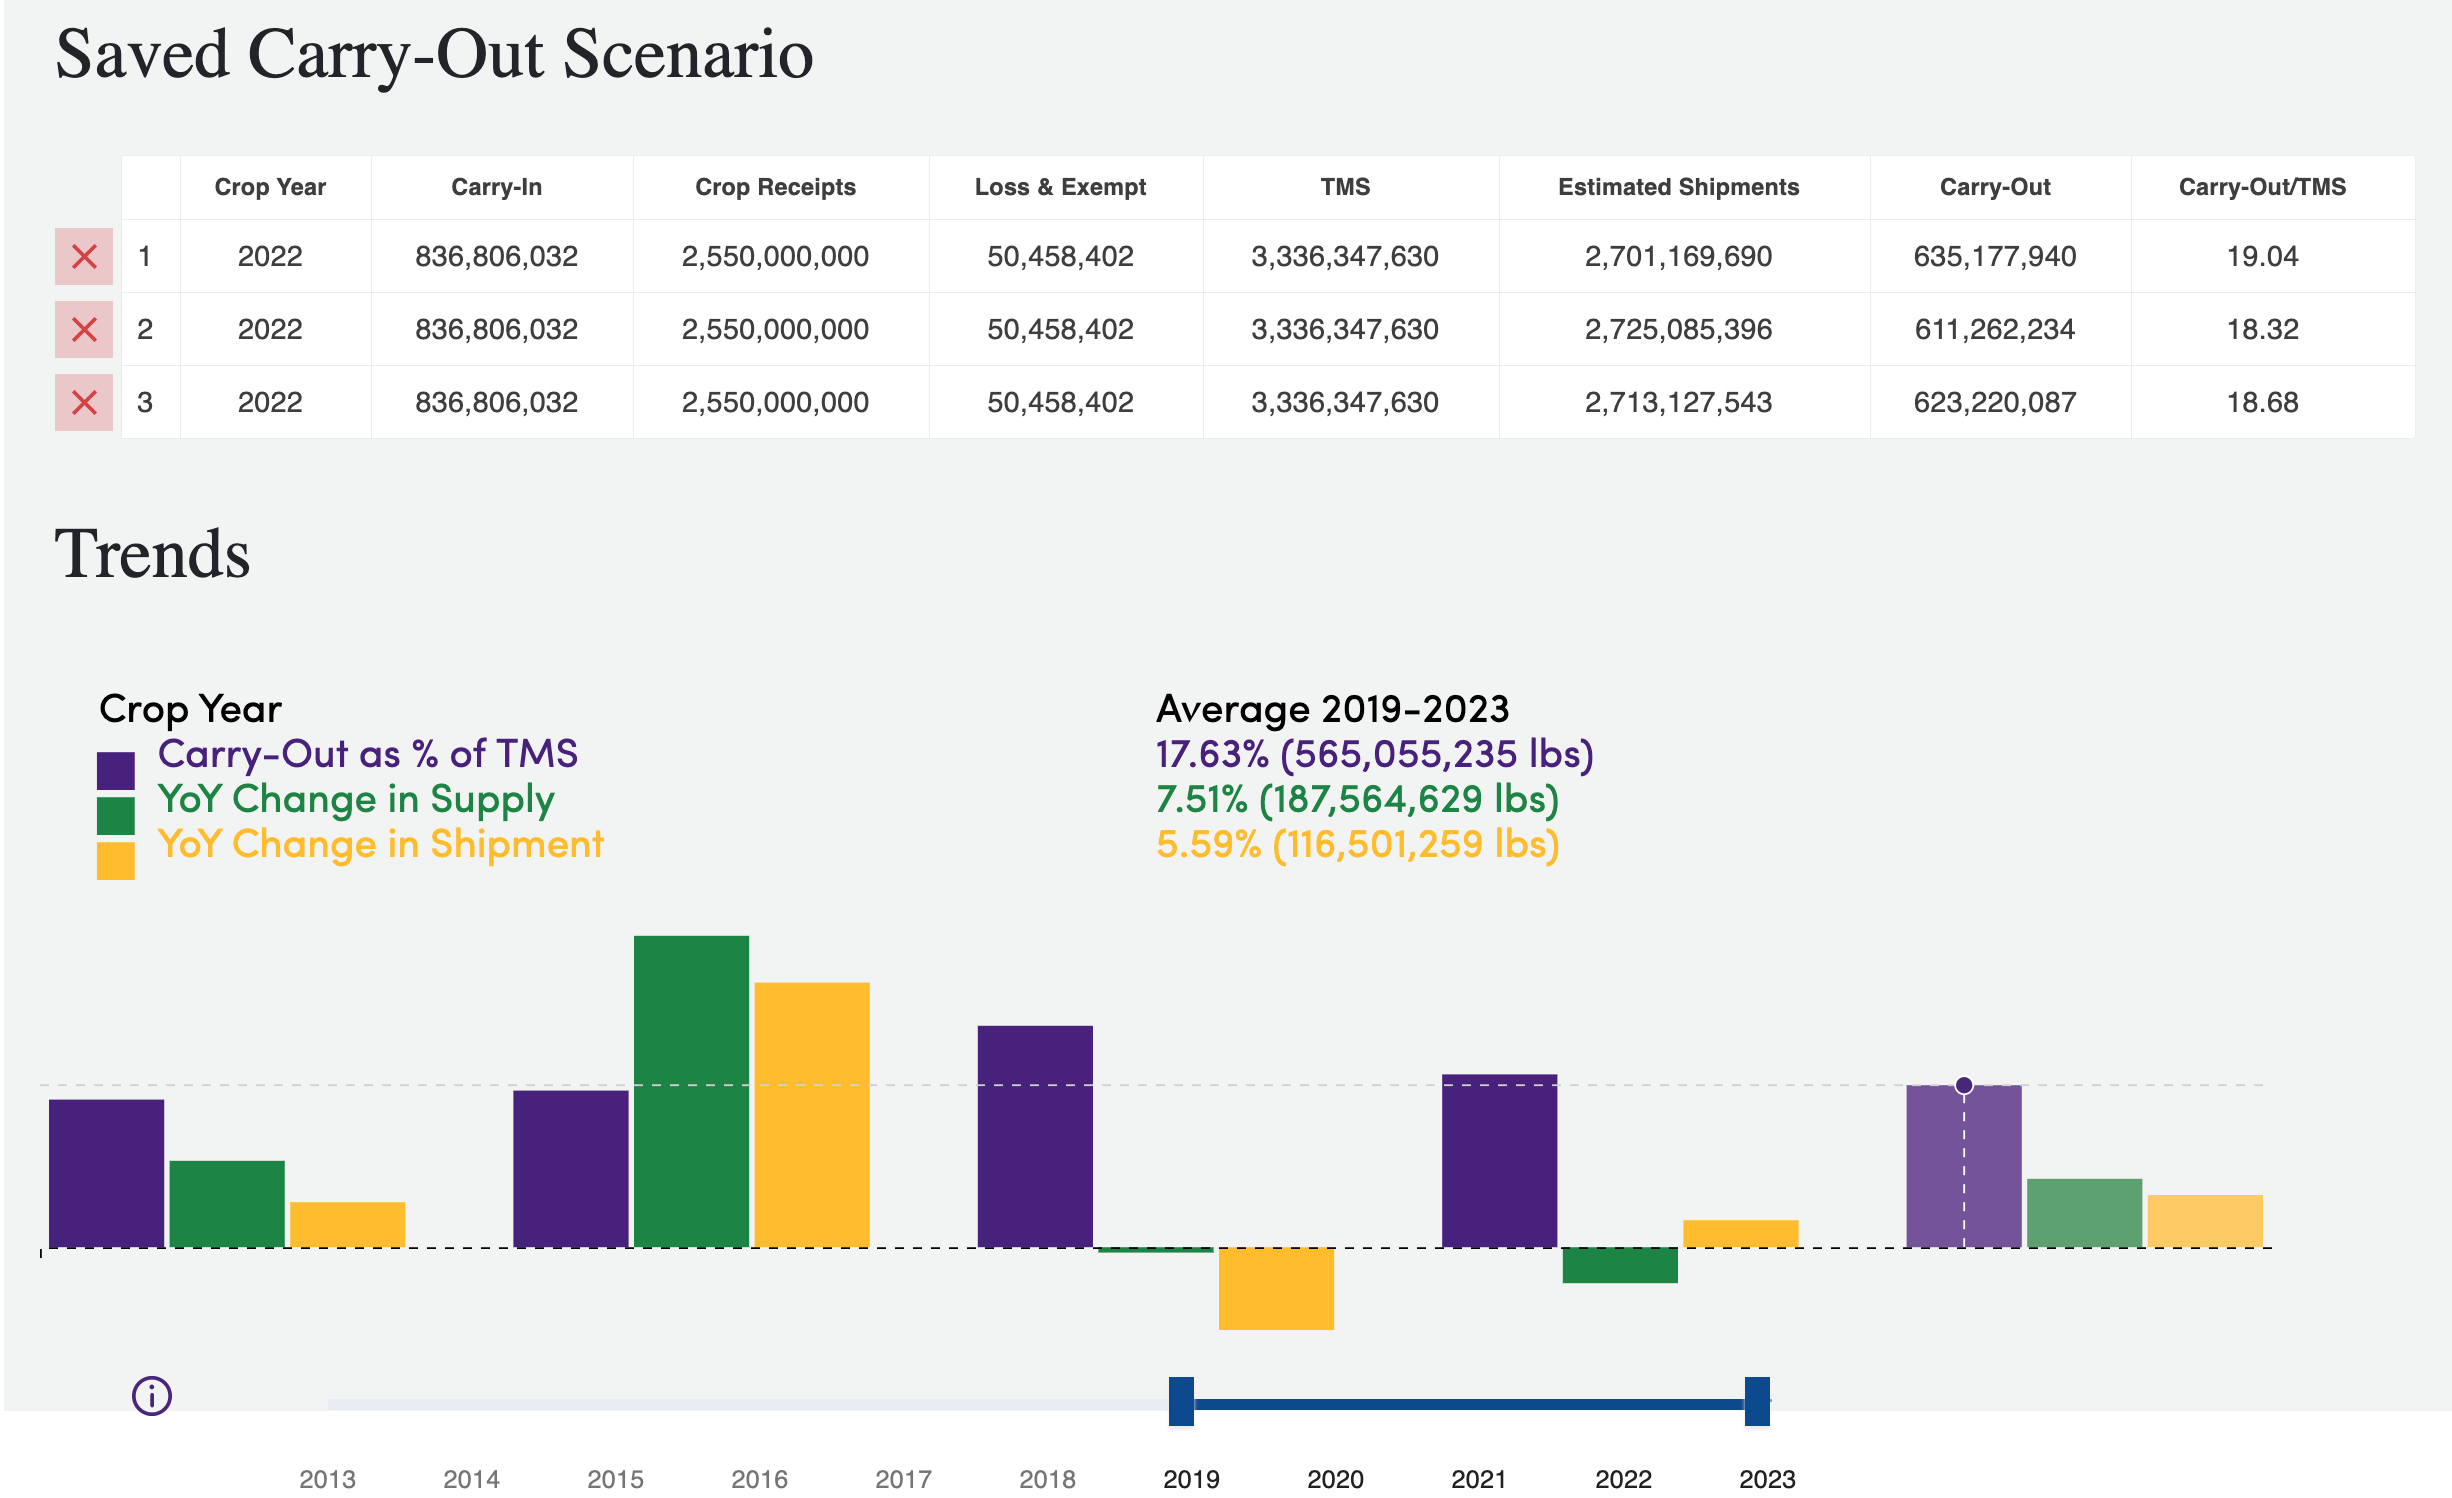
When we first started providing the almond market with data-driven insights, I was told in my early days that commitments don’t mean much and folks don’t really track them. Well, that’s starting to change... By looking at commitments in relation to shipments we can uncover sales.
New sales, is a metric that has seemingly taken the market by storm. You'll find processors and traders alike are including this metric in their market reports now. New sales are calculated using total shipments and total commitments in a given month minus the previous month.
Monthly new sales for:
- February 190,267,497 M lbs, down -45.66%
- over January new sales of 350,113,809 M lbs.
The juxtaposition of now tracking this data from a few years ago plus conversations surrounding monthly new sales has got me thinking...
What do cumulative new sales to date look like in relation to actual shipments? How does the same snapshot in time look when compared to the last three years? And what's the difference in what was sold vs shipped?
And I'm attempting to answer the questions above using data from the Bountiful platform and some light math.
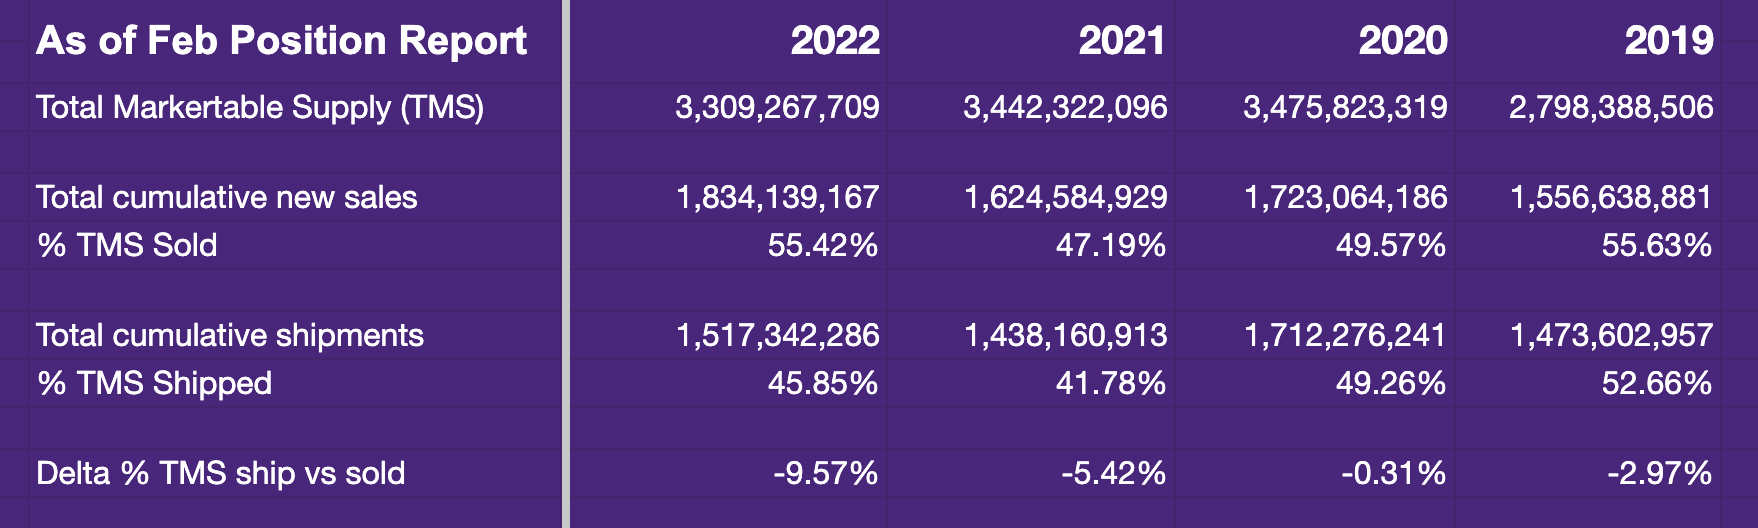
The table above 👆 is a snapshot in time, as of the February position report for the years 2022 to 2019. Specifically looking at
- Total Marketable Supply (TMS)
- Total cumulative new sales
- % TMS Sold
- Total cumulative shipments
- % TMS Shipped
- Delta % TMS ship vs sold
You'll notice the delta on % TMS Sold has been greater than % TMS Shipped for these years. Meaning the almond market has been increasing pipeline sales volume, but is not converting those sales into $$$ aka shipments have been further lagging in recent years behind sales.
Do you believe this trend will continue? I'd love to hear what you think and how you're using New Sales to drive your buy/sell strategy.
Subscribe to Weekly Almond Update for the latest almond market intelligence and industry news.