
 By
By
To say that California's winter and early spring has been wet, is an understatement. There have been anywhere from 11-14 atmospheric events since December with the number varying depending on who you ask. As such, major flooding has occurred across the state.
One interesting outcome of all this weather to many of us in agriculture, is the flooding and re-emergence of Tulare Lake. This was once the largest freshwater lake west of the Mississippi. The history around the lake, its infrastructure and subsequent farming on the land has a long and varied past.
Since the dried lake basin is now mostly farmed and many farming communities have grown in the areas near and around the lake, the flooding is having devastating consequences. We'd thought we'd put our remote sensing skills to use to track the flooding via satellite imagery.
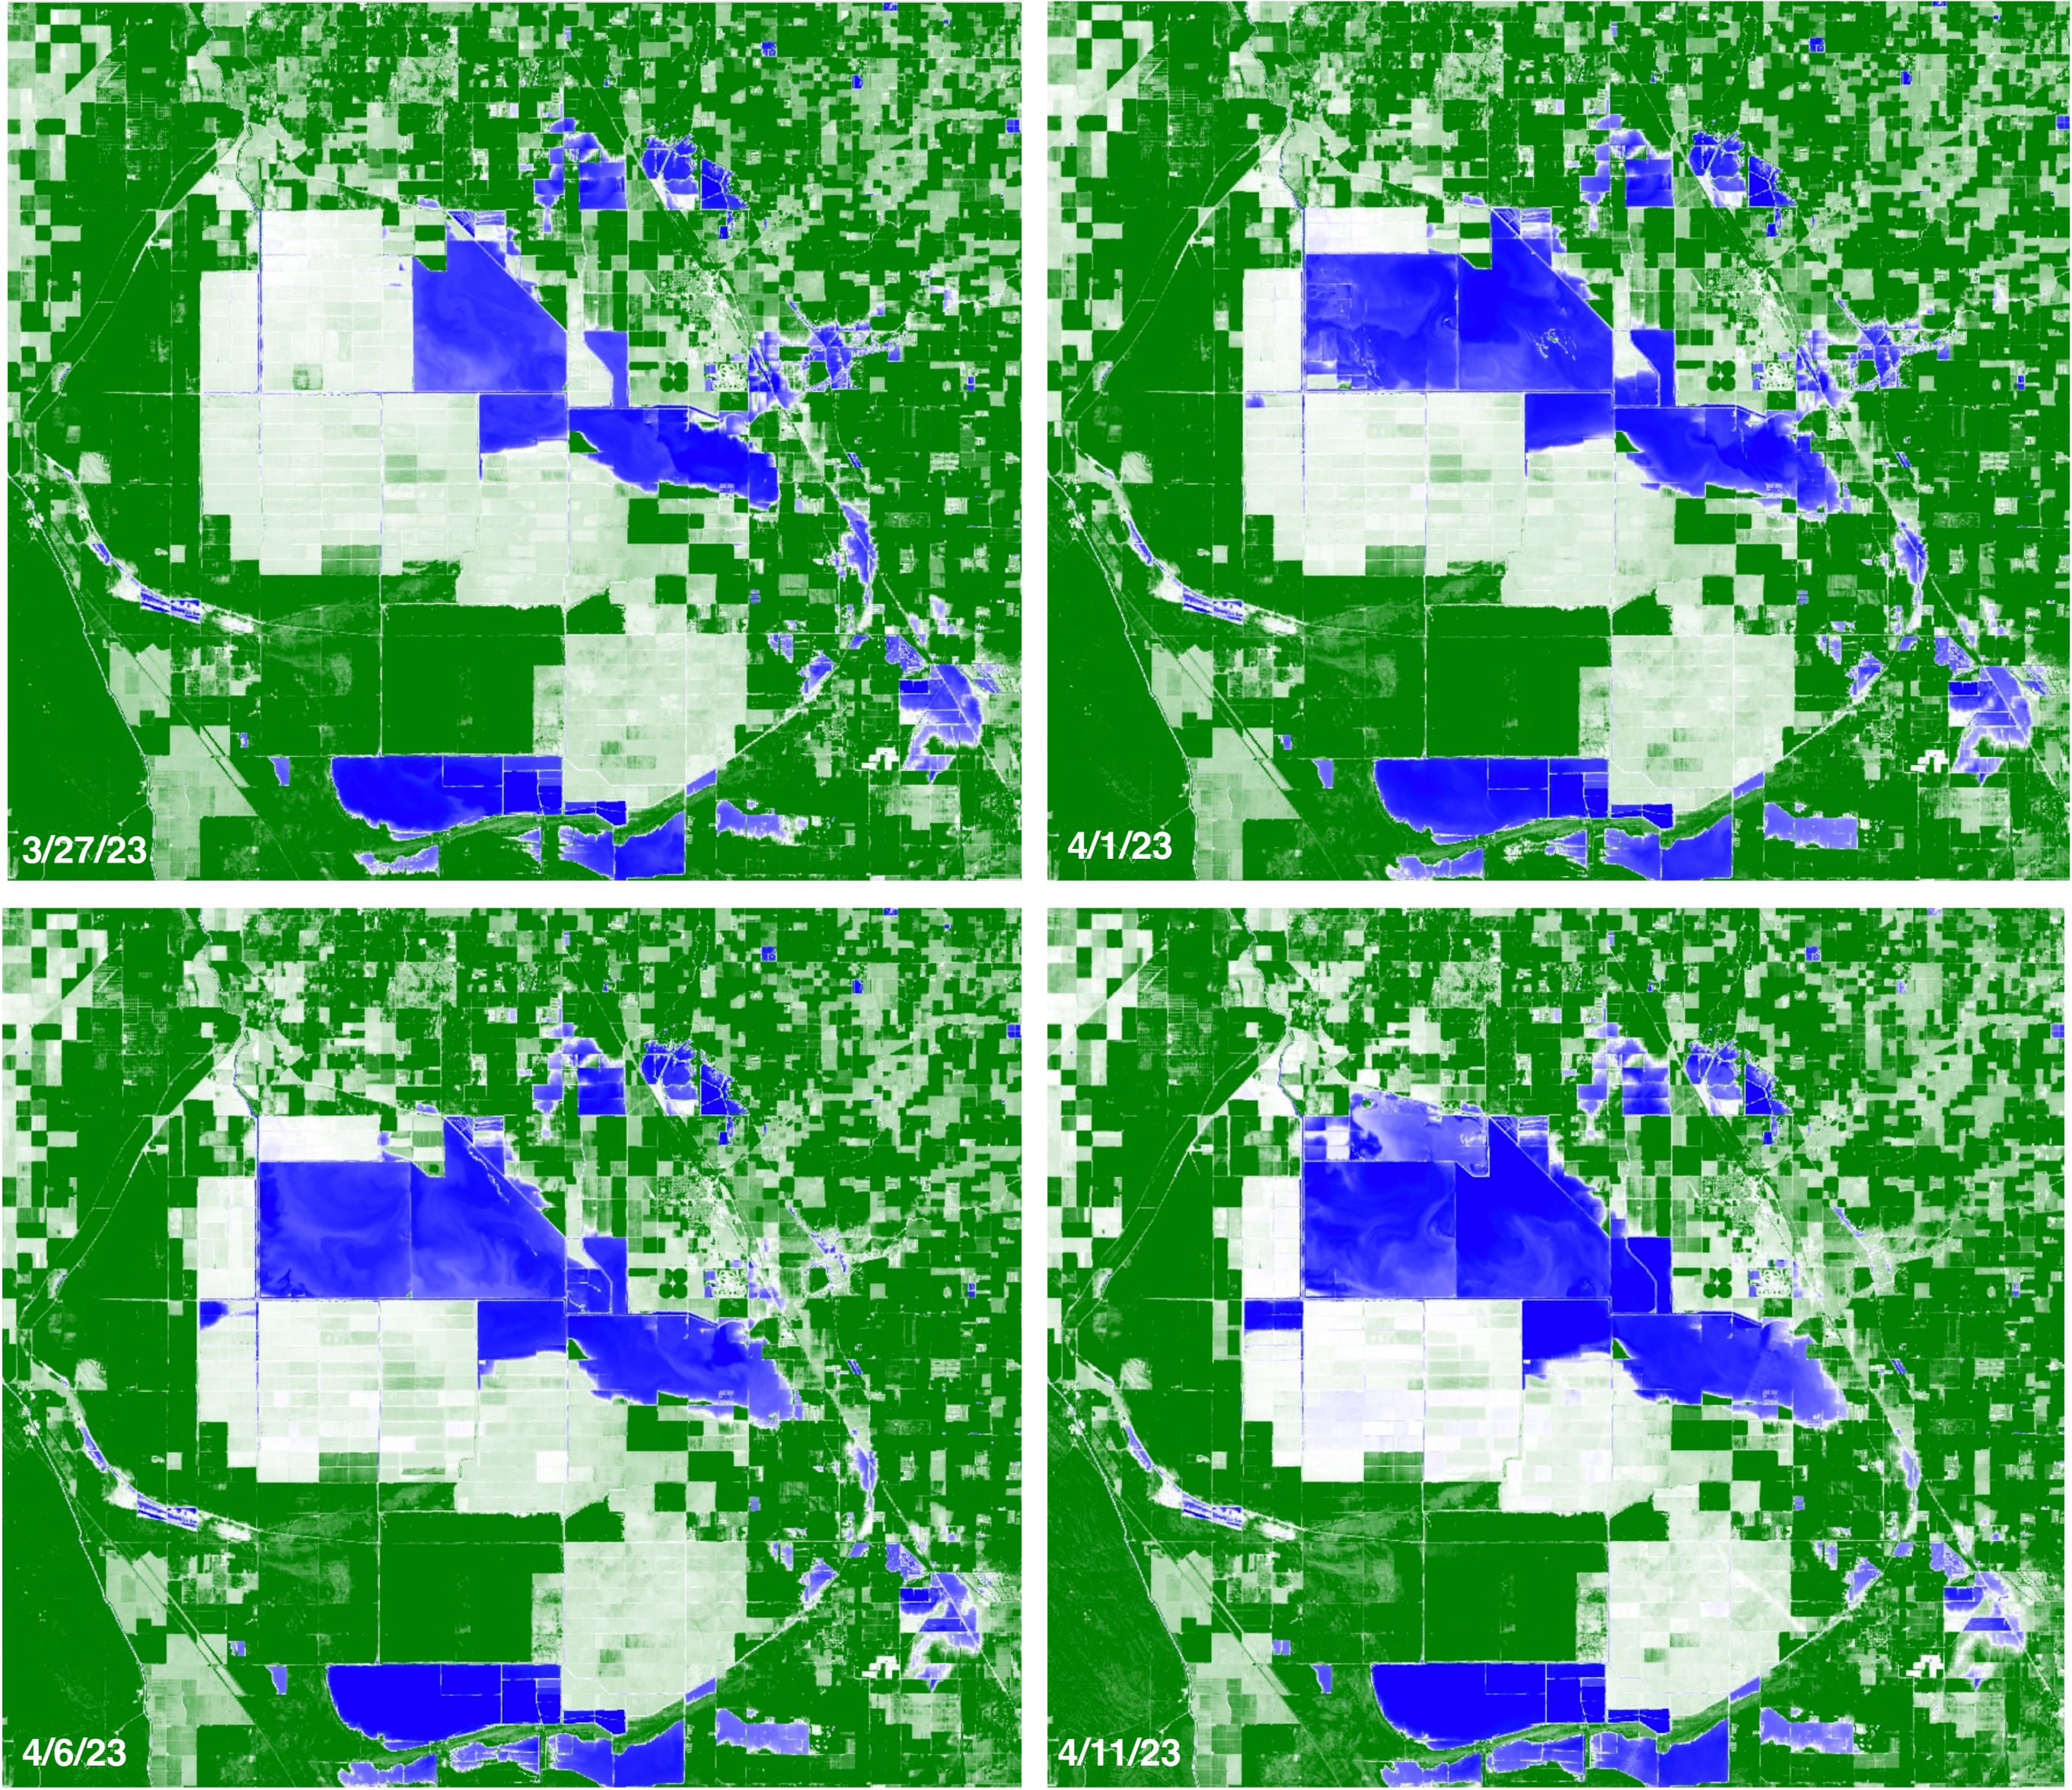
We queried one our remote sensing datasets to map out cloud free imagery of the Tulare Lake area to measure and track the flooding progression.
Sentinel 2 multi-band imagery was utilized as it was the best combination of resolution and frequency of publicly available imagery. It has a decent Ground Sampling Distance (GSD) or resolution of 10 meters and a frequency or revisit time of ~ 5 days.
Utilizing an imagery index called Normalized Difference Water Index (NDWI), we could detect water content and more importantly bodies of water compared to farmland or bare soil. The index is calculated from the green and near-infrared (NIR) spectral bands from Sentinel 2 as (Green- NIR)/(Green + NIR). Basically, the green wavelengths help show the reflectance of water features and the NIR wavelengths help show the reflectance of vegetation and soil. Here is a great, more in-depth explanation into NDWI.
Series of NDWI images starting 3/27/23 to 4/11/23
The following false color NDWI images highlight major flooding event changes of the area. The blue represents bodies of water, the green represents vegetation and white represents bare soil.
How many flooded acres?
We mapped the lake basin boundary to what the lake could like at full capacity today based on the USGS's Light Detection and Ranging (lidar) mapping from 2019. This covers an area of about 366,800 acres. See the green area in the image below. We then masked the pixels that represent bodies of water and overlaid that with the lake boundary and calculated roughly the number of acres with flooding in the area (blue is flooding as of 4/11/23).
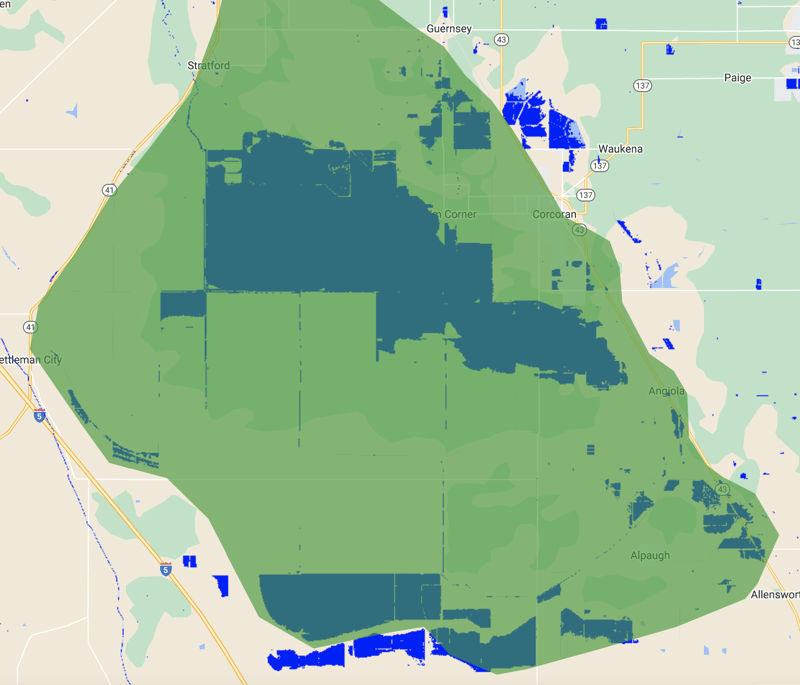
Note, these numbers and pixel counts are estimates based on remotely sensed imagery and may vary depending on the day and time of image capture.
3/27/23: 57,700 flooded acres
4/1/23: 75,300 flooded acres
4/6/23: 75,600 flooded acres
4/11/23: 83,350 flooded acres
What does this all mean? Well, we aren't here to draw conclusions or make comments on how or why the areas flood. What we do know, is that this flooding situation continues to get worse. As a state, we are also at all time record highs for snow pack and at 60.7 inches of snow water equivalent. So as the weather continues to warm, this snow will melt and enter our water infrastructure and continue to add the water issues we have. Let's hope this happens slowly and not all at once!
To stay update to date on the latest for the Tulare Lake flooding or specialty crops for agriculture, follow us on our social media pages at the bottom of the page.
If you have feedback or more information on the flooding, reach out to us, we'd love to hear from you!
Subscribe to Bountiful to never miss an update. Bountiful is a data analytics and market intelligence company for specialty crops. Powering the agriculture value chain to farm, buy or sell smarter. Get in touch to learn more about Bountiful!
Other resources:
General water and specific Tulare flooding updates: https://sjvwater.org/news/
Google Earth Engine interactive flooding map by GreenGood Labs: https://www.greengoodlabs.com/tulare-lake
Sentinel 2: https://sentinels.copernicus.eu/web/sentinel/missions/sentinel-2/overview
Imagery spectral bands and products: https://eos.com/make-an-analysis/
