Weekly Almond Market Update: 11/10/22 to 11/16/22
Welcome to your weekly almond market update from Bountiful.
Will you be attending the Almond Conference this year? I'll be there and would love to catch up with you and buy you a drink or coffee. Let me know!
Keep reading for this week's latest or sign in to the Bountiful platform to access your Agriculture, Market, and Community data-driven insights.
🤔 Changing demand patterns?
In last week's weekly almond market update, I asked a question: Do you think demand and shipment trends have changed in the almond industry?
I asked this question last year around this same time, albeit in conversation with a few of our customers, I haven't written on the topic.
A look at the past?
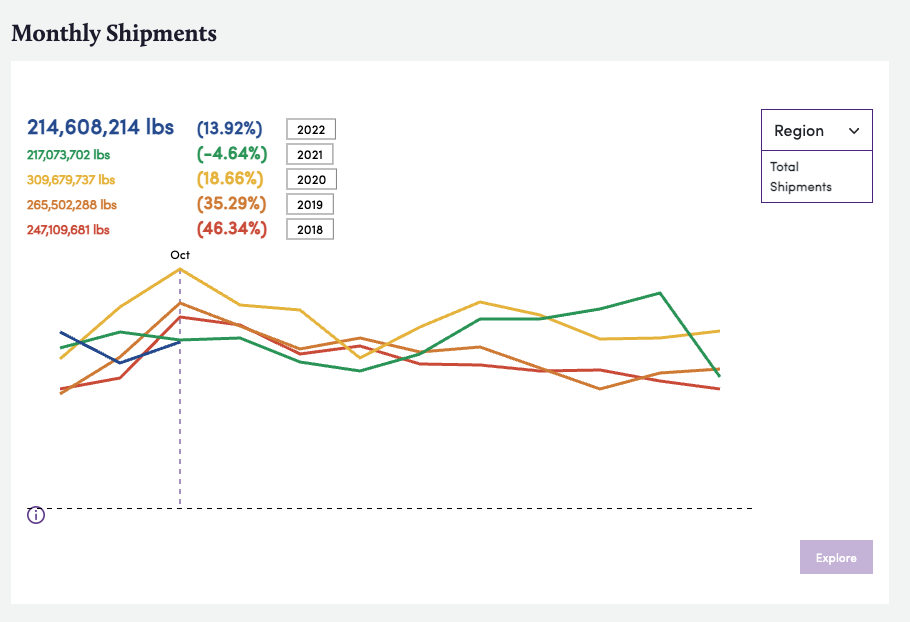
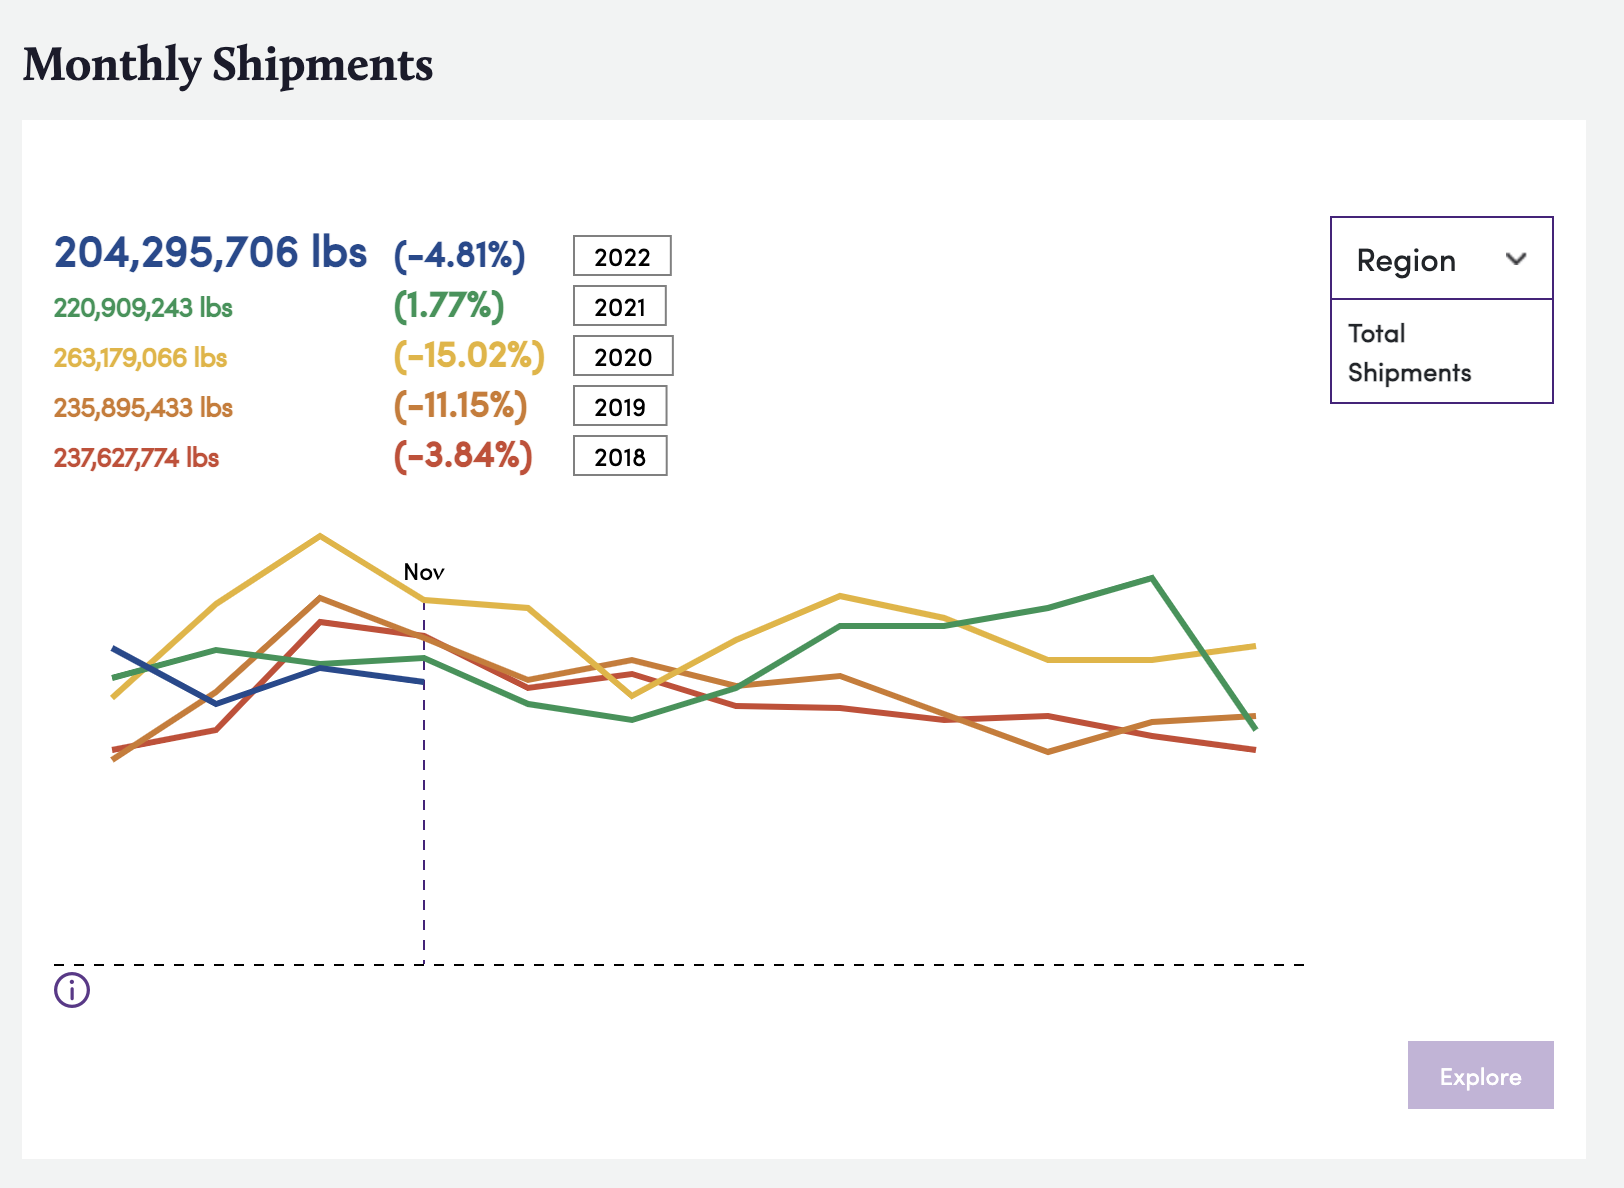
Below you'll find a Monthly shipments chart showing the total monthly shipments of California almonds, starting in August and ends July. Each colored line on the graph corresponds with a year:
- 2022 in blue
- 2021 in green
- 2020 in yellow
- 2019 in orange
- 2018 in red
And you'll notice, per the screenshot I took from the Bountiful platform, I've highlighted, October notably the OG peak period of demand (shipments).

A shift in peak demand?
Per the data and visualization above, it seems the peak demand period has shifted to the latter half of the marketing year. As opposed to the seasonality of holidays driving early demand. This of course has all been compounded by Covid, shipment delays, and carry-over from larger crops.
This leaves me wondering will this pattern continue. If so for how long? And can our industry depend on our business-as-usual knowledge to respond to changing demand patterns?
Is this something you've noticed? I'd love to hear your thoughts. I personally am curious to know if the trend and pattern will hold true in the coming year.
Explore the data for yourself on the Bountiful platform.
Subscribe to Weekly Almond Update for the latest almond market intelligence and industry news.


